You don’t need any artistic abilities to create great visuals (I’m one of those people who can only draw stick figures!).
In fact, spatial intelligence–our ability to visualize the world around us–is one of the nine intelligence types each one of us possesses to some degree. Practice expressing yourself visually and you’ll be surprised as how it quickly becomes second nature.
So how do you visualize your ideas?
Your old standby bar graphs and pie charts are just the tip of the iceberg–it’s not uncommon now to see executives and professionals of all stripes working on visuals instead of hunkering down at the keyboard for a long session of pecking away in Word.
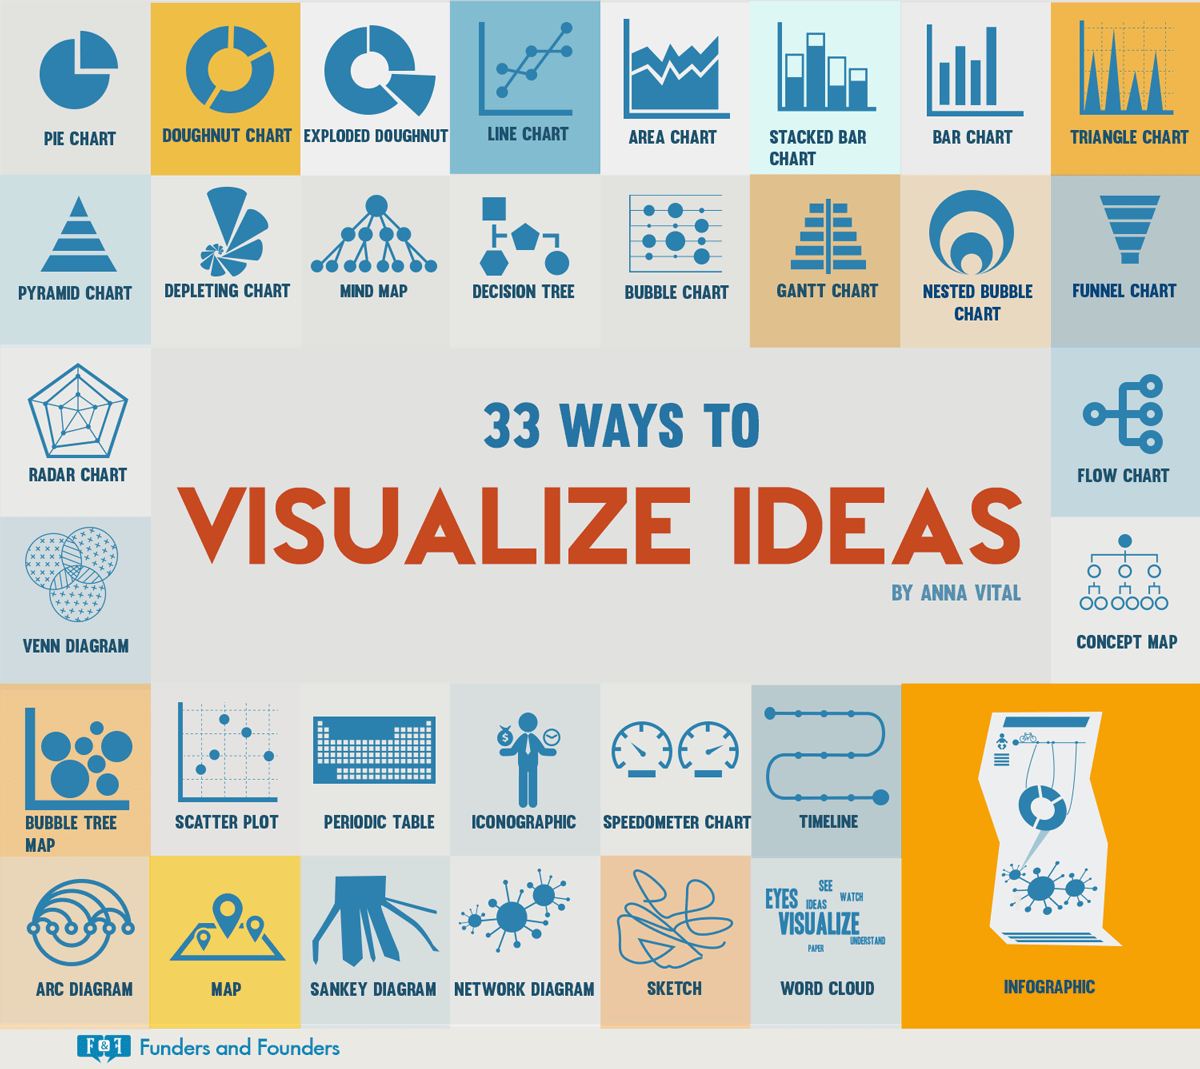
The people over at Funders & Founders shared this interesting infographic recently, with 33 different ways to visualize your ideas. Unleash your inner creative and challenge yourself to try one of these visual formats the next time you need to pitch your idea to a colleague or client.

Be a Unicorn in a Sea of Donkeys
Get my very best Unicorn marketing & entrepreneurship growth hacks:
- Sign up to have them sent to your email directly
- Sign up for occasional Facebook Messenger Marketing news & tips via Facebook Messenger.
Originally posted in Inc.com
